When was the last time you played sports, or ran, or walked your dog, or swam, or did anything outside in the summer in the shade? Never, right? So why do we use “heat index,” which is based on what it feels like in the shade?

That’s right, orange tie guy. You’ve been playing outside in the sun, raised on “heat index,” which measures the shade. You’ve been getting Heat Advisories based on shade temps. You’ve been given high temperatures from the shade. That car thermometer saying it’s 101°? Yeah, that’s probably right.
It makes sense to use a “feels like” standard of measure that makes some sense, that at the very least takes direct sunlight into account. That’s what the Wet Bulb Globe Temperature does.
WBGT considers direct sunlight, relative humidity (dewpoint), wind, cloud cover, and sun angle. Basically, it takes everything into account where we are actually sporting, swimming, running, whatever.
Excuse me. I have a question. So why have we been using heat index all these years? Thanks for asking! Probably because heat index is easily calculated. Take the temp (in the shade) and dewpoint (in the shade) and it’s a simple conversion. Simple is great, as long as its useful. Which it really isn’t.

The weather community hasn’t been using WBGT because of the calculation problem. The main problem is that official thermometers are shaded. WBGT measuring devices are out there, but they’re few and far between. So, we’ve stopped complaining about it. We bought a portable one, and will be using it and tweeting about it from time to time.
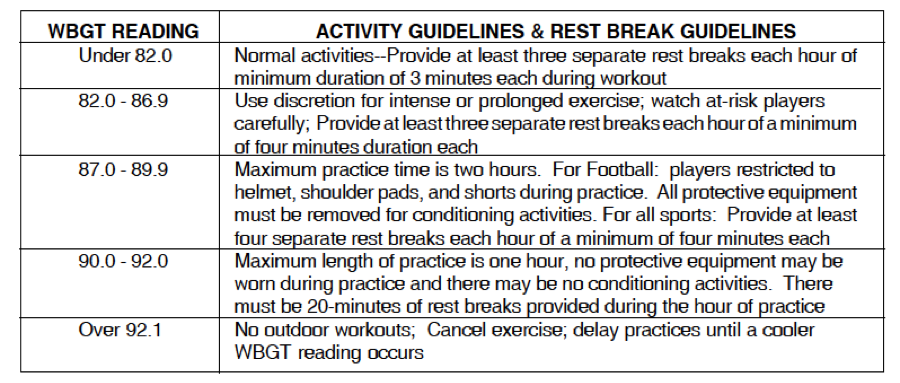
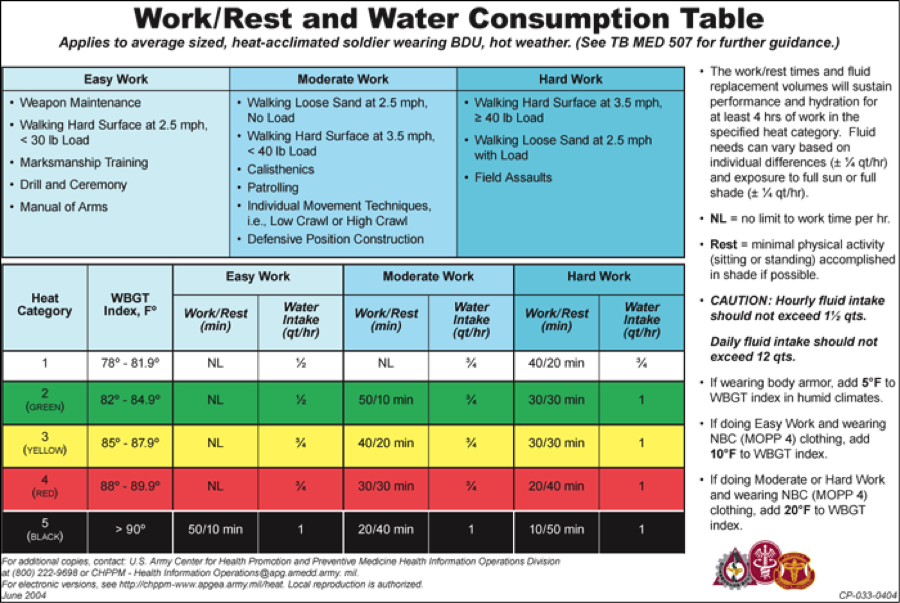
So, what’s the WBGT scale? A dangerous heat index is always higher than the temperature. That’s not true with WBGT — readings approaching/surpassing 90 are the most dangerous.
WBGT guidelines must be region (geographic) specific since temperatures fluctuate differently by regions. People’s response to exercising in heat may vary by the geographic region in which their usual exercise sessions take place. The closest one to us, and which makes the most sense to me, is from Georgia. I love the below chart.
Georgia High School Athletics

There are other scales out there, but I find the above chart the most helpful.
NOAA
OSHA, US Military


